The problem with Intel Mac is that there are no software for it. Since maybe two months there is Matlab, thanks God, but I still miss SPSS, or any other statistical software different than Excel!. I have just receive an email about something called project R. I was interested by the mail; hence, I found out that it is a statistical program. I hope that it is what I was looking for, or at least will be easy to learn, on the condition that it will be nice. At the moment I'm waiting, because installation through DarwinPorts takes ages, thus I have time to write something (in fact, I have not time, but checking this new soft is just excuse from work). As soon as the installation succeed I will check it, whether it was worth installing or not.
Installation has just succeeded, although it was very, very long. Just to check it, I used an example (creation of box plots) available in a official manual:
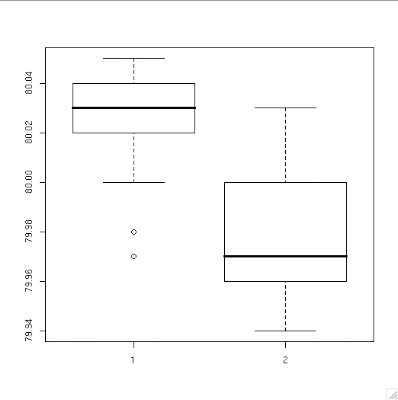
One can see that it was very easy, and this fast test is quite encouraging to spend some more time with this R.
95% confidence interval in R:
Installation has just succeeded, although it was very, very long. Just to check it, I used an example (creation of box plots) available in a official manual:
 A <- scan()
    79.98 80.04 80.02 80.04 80.03 80.03 80.04 79.97
    80.05 80.03 80.02 80.00 80.02

    B <- scan()
    80.02 79.94 79.98 79.97 79.97 80.03 79.95 79.97

boxplot(A, B) 
One can see that it was very easy, and this fast test is quite encouraging to spend some more time with this R.
95% confidence interval in R:
>X1 <- scan()
1: 205 179 185 210 128 145 177 117 221 159
2: 205 128 165 180 198 158 132 283 269 204
> a <- mean(X1)
> s <- sd(X1)
> n <- length(X1)
> errZ <- qnorm(0.975)*s/sqrt(n)
> errT <- qt(0.975,df=n-1)*s/sqrt(n)
>left <- a-errT
>right <- a+errT
No comments:
Post a Comment